Latte: Cross-framework Python Package for Evaluation of Latent-Based Generative Models

by Karn N. Watcharasupat and Junyoung Lee

Controllable deep generative models have promising applications in various fields such as computer vision, natural language processing, or music. However, implementations of evaluation metrics for these generative models remain non-standardized. Evaluating disentanglement learning, in particular, might require implementing your own metrics, possibly entangling you more than when you started.

Latte (for latent tensor evaluation) is a package designed to help both you and your latent-based model to stay disentangled at the end of the day (YMMW, of course). The Python package is, by design, created to work with both PyTorch and TensorFlow. All metrics are first implemented in NumPy with minimal dependencies (like scikit-learn) and then a wrapper is created to turn these NumPy functions into TorchMetrics or Keras Metric modules. This way, each metric is always calculated in the exact same way regardless of the deep learning framework being used. In addition, the functional NumPy API is also exposed, so that post-hoc evaluation or models from other frameworks can also enjoy our metric implementations.

Currently, our package supports the classic disentanglement metrics: Mutual Information Gap (MIG), Separate Attribute Predictability (SAP), Modularity. In addition, several dependency-aware variants of MIG proposed here and here are also included. These metrics are useful for situations where your semantic attributes are inherent dependent with respect to one another, a situation where traditional metrics might penalize a latent space that has correctly learned the nature of the semantic attributes. Latte also implements interpolatability metrics which evaluate how smoothly or monotonically your decoder translates the latent vectors into generated samples.

To make life simpler, Latte also comes equipped with metric bundles which are optimized implementations of multiple metrics commonly used together. The bundles optimize away duplicate computation of identical or similar steps in the metric computation, reducing both the lines of code needed and the runtime. We are working to add more metrics and bundles into our package. The most updated list can always be found at our GitHub repository.

Latte can be easily installed via pip using pip install latte-metrics. We have also created a few Google Colab notebooks demonstrating how you can use Latte to evaluate an attribute-regularized VAE for controlling MNIST digits, using vanilla PyTorch, PyTorch Lightning, and TensorFlow. The full documentation of our package can be found here.

Resources

From labeled to unlabeled data – on the data challenge in automatic drum transcription

by Chih-Wei Wu

Automatic Drum Transcription (ADT) is an on-going research topic that concerns the extraction of drum events from music signals. After roughly three decades of research on this topic, many methods and several datasets have been proposed to address this problem. However, similar to many other Music Information Retrieval (MIR) research topics, the availability of realistic and carefully curated datasets is one of the bottlenecks for advancing the performance of ADT systems.

In our previous blog post, we briefly discussed this challenge in the context of ADT. With a standard annotated dataset (i.e., ENST drums) and a small collection of unlabeled data, we demonstrated the possibility of harnessing unlabeled music data for improvements in the context of ADT.
In this paper, we explore this idea further in the following directions:

  1. Identify the major types of ADT systems and investigate generic methods for integrating unlabeled data into these systems accordingly
  2. Train the systems using a large scale unlabeled music dataset
  3. Evaluate all systems using multiple labeled datasets currently available

The intention is to validate the idea of using unlabeled data for ADT in a large scale. To achieve this goal, we present two approaches.

Method

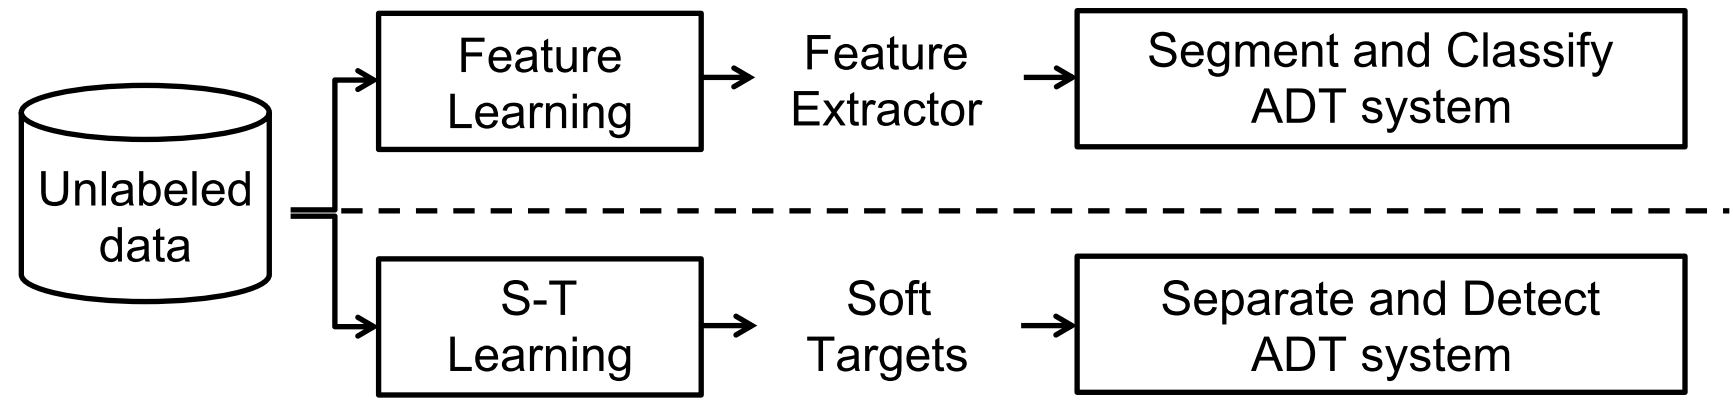
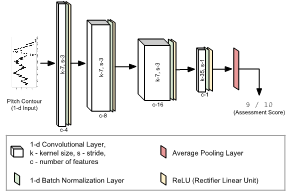
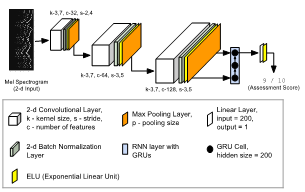
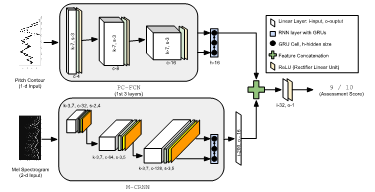
To show that the benefit of using unlabeled data can be generalized to most ADT systems, the first thing is to identify the most popular ADT approaches. To this end, we reviewed existing ADT systems (for more information, please refer to this recent publication), and we found that the two most popular approaches can be categorized as Segment-and-classify ( classification-based) and Separate-and-detect (activation-based).

Based on these two types of approaches, two learning paradigms for incorporating unlabeled data are evaluated. These are

    1. Feature Learning and
    2. Student Teacher Learning.

As shown in the figure below, both paradigms may extract information from unlabeled data and transfer them to ADT systems through different mechanisms; the feature learning paradigm learns a feature extractor that computes distinctive features from audio signals, whereas the student teacher learning paradigm focuses on generating “pseudo ground truth” (i.e., soft targets) using teacher models and passing them onto student models. Different variants of both paradigms are evaluated.

Results 1: we need more labeled data

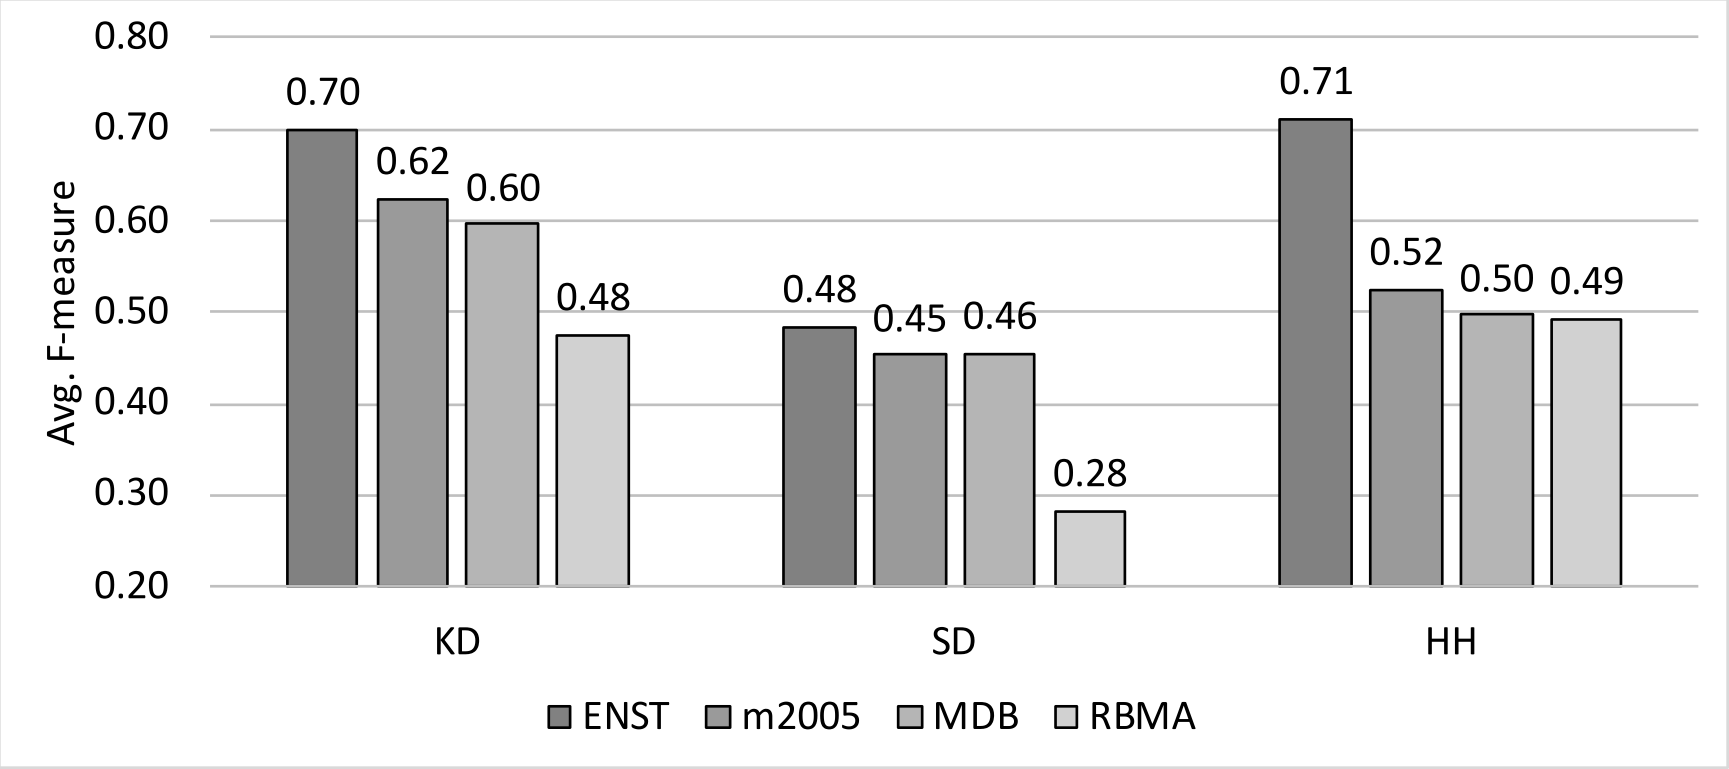
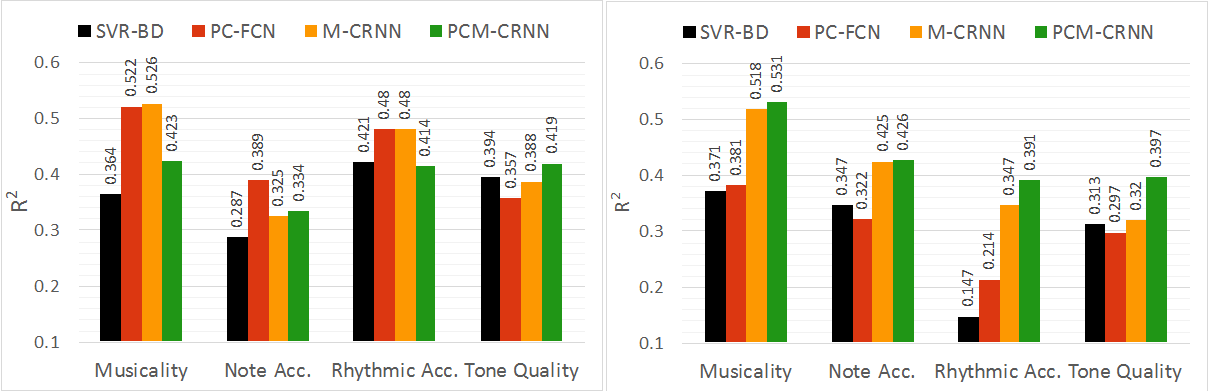
In the first part of the experiment results, the averaged performance across all evaluated systems for each labeled dataset (e.g, ENST drums, MIREX 2005, MDB drums, RBMA) is presented. As shown in the following figure, for each individual drum instrument such as Kick Drum (KD), Snare Drum (SD), and HiHat (HH), the averaged performances differ from dataset to dataset. This result not only shows the relative difficulties of these datasets, but also implies the danger of relying on solely one dataset (which is exactly the case in many prior ADT studies). This result highlights the need for more diverse labeled datasets!

Results 2: unlabeled data is useful

In the second part of the experiment results, different systems for each learning paradigm are compared under the controlled conditions (e.g., training methods, the number of unlabeled examples used, etc.). For feature learning paradigm, as shown in the following table, both evaluated systems outperformed baseline systems on SD for the averaged F-Measure. This improvement was confirmed through a statistical check. This result suggests Segment-and-classify ADT systems can successfully benefit from unlabeled data through feature learning.

Role System HH BD SD
Baseline MFCC 0.61 0.62 0.40
Baseline CONV-RANDOM 0.61 0.54 0.39
Evaluated CONV-AE 0.61 0.62 0.42
Evaluated CONV-DAE 0.61 0.61 0.42

For student-teacher learning paradigm, encouraging results can also be found (this time on HH). In the following table, it is shown that all student models performed better on HH compared to both teacher models. This result indicates the possibility of obtaining students that are better than teachers with the help of unlabeled data. Additionally, this result confirms the finding in our previous paper in a larger scale.

Role System HH BD SD
Teacher PFNMF (SMT) 0.47 0.61 0.45
Teacher PFNMF (200D) 0.47 0.67 0.40
Student FC-200 0.56 0.57 0.44
Student FC-ALL 0.53 0.59 0.42
Student FC-ALL (ALT 0.55 0.58 0.44

Conclusion

According to the results, both learning paradigms can potential improve the ADT performances with the addition of unlabeled data. However, each paradigm seems to benefit different instruments. In other words, it is not easy to conclude which paradigm is “the way to go” when it comes to harnessing unlabeled resources. To simply put it, unlabeled data certainly has potential in improving ADT systems, and further investigation is worthwhile.

If you are interested in learning more details about this work, please refer to our paper. The code is available on github.

On the evaluation of generative models in music

by Li-Chia Richard Yang

Generative modeling among creative systems has research interest in a wide variety of tasks. Just as deep learning has reshaped the whole field of artificial intelligence, it has reinvented generative modeling in recent years, e.g., in music or painting. Regardless, however, of the research interest in generative systems, the assessment and evaluation of such systems has proven challenging.

In recent research on music generation, various data-driven models have shown promising results. As a quick example, here are two generated samples from two distinct systems:

Magenta (Attention RNN)
Magenta (Lookback RNN)


Now, how can we analyze and compare the behavior of these models?
As the ultimate judge of creative output is the human (listener or viewer), subjective evaluation is generally preferable in generative modeling. However, the general drawbacks of subjective evaluation can be summarized as various issues related to the required amount of resources and to the experiment design. Furthermore, objective evaluation has the advantage of providing a systematic, repeatable measurement across a significant amount of generated samples.

The proposed evaluation strategy

The proposed method does not aim at assessing musical pieces in the context of human-level creativity nor does it attempt to model the aesthetic perception of music.

It rather applies the concept of multi-criteria evaluation in order to provide metrics that assess basic technical properties of the generated music and help researchers identify issues and specific characteristics of both model and dataset. In a first step, we define two collections of samples as our datasets (in case of objective evaluation, one dataset contains the generated samples, the other contains samples from the training dataset). Then, we extract a set of features based on musical domain-knowledge for two main targets of the proposed evaluation strategy:

Absolute MeasurEments

Absolute measurements give insights into properties and characteristics of a generated or collected set of data.
During the model design phase of a generative system, it can be of interest to investigate absolute metrics from the output of different system iterations or of datasets as opposed to a relative evaluation. A typical example is the comparison of the generated results from two generative systems: although the model properties cannot be determined precisely for a data-driven approach, the observation of the generated samples can justify or invalidate a system design.
For instance, an absolute measurement can be a statistic analysis of note length transition histogram of each sample of a given dataset. In the following figure, we can easily observe the difference of such this feature among datasets from two different genres.

Relative Measurements

In order to enable the comparison of different sets of data, the relative measure generalizes the result among features with various dimensions.
We first perform pairwise exhaustive cross-validation for each feature and smooth the histogram results into probability density functions (PDFs) for a more generalizable representation. If the cross-validation is computed within one set of data, we will refer to it as intra-set distances. If each sample of one set is compared with all samples of the other set, we call it the inter-set distances.
Finally, we measure the similarity between these distributions for the application of evaluating music generative systems, and compute two metrics between the target dataset’s intra-set PDF and the inter-set PDF: the Kullback-Leibler Divergence (KLD) and overlapped area (OA) of two PDFs.
Take the following visualized figure as an example: assume set1 is the training data, while set2 and set3 correspond to generated results from two systems. The analysis can provide a quick observation It can be easily observed that the system that generates generated set2 produces results more in line has a closer behavior in such feature with the training data (in the context of this feature).

Find out more

Check out our paper for detailed use-case demonstration and the released toolbox for further application.

Instrument Activity Detection in Polyphonic Music

by Siddharth Gururani

Most forms of music are rendered as a mixture of acoustic and electronic instruments. The human ear, for the most part, is able to discern the instruments being played in a song fairly easily. However, the same is not true for computers or machines. The task of recognizing instrumentation in music is still an unsolved and active area of research in Music Information Retrieval (MIR).

The applications of such a technology are manifold:

  • Metadata which includes instrumentation enables instrument-specific music discovery and recommendations.
  • Identifying regions of activity of specific instruments in a song allows easy browsing for users. For example, a user interested in a guitar solo or vocals in a song can easily browse to the relevant part.
  • Instrument activity detection may serve as a helpful pre-processing step for other MIR tasks such as automatic transcription and source separation.

In our work, we propose a neural network-based system to detect activity for 18 different instruments in polyphonic music.

Challenges in Instrument Activity Detection

A big challenge in building algorithms for instrument activity detection is the lack of appropriate datasets. Until very recently, the IRMAS dataset was used as the benchmark dataset for instrument recognition in polyphonic music. However, this dataset is not suitable for an instrument activity detection because of the following reasons:

  • The test set contains 3 to 10 second snippets of audio that are only labeled with instruments present instead of a fine-grained instrument activity annotation.
  • The training clips are labeled with a single ‘predominant’ instrument even if more than one instrument is active in the clip.

We overcome this challenge by leveraging multi-track datasets such as the MedleyDB and Mixing Secrets dataset. These multi-track datasets contain the mixes as well as the stems accompanying them. Therefore, annotations for fine-grained stem activity may be automatically obtained by applying envelope tracking on the instrument stems.

In addition, we identify metrics that allow easier comparison of models for instrument activity detection. Traditional metrics such as precision, recall and f1-score are both threshold dependent and not ideal for multi-label classification scenarios. We use label-ranking average precision (LRAP) and area under the ROC curve (AUC) for comparison between different model architectures. Both these metrics are threshold agnostic and are suitable for multi-label classification.

Method and Models

We propose a rather simple pipeline for our instrument activity detection system. The block diagram below shows the high-level processing steps in our approach. First, we split our all the multi-tracks into artist conditional splits. We obtain 361 training tracks and 100 testing tracks. During training, the various models are fed with log-scaled mel-spectrograms for 1 second clips for the training tracks. We train these models to predict all the instruments present in a 1 second clip. We compare Fully Connected, Convolutional (CNN) and Convolutional-Recurrent (CRNN) Neural Networks in this work.

During testing, a track is split into 1 second clips and fed into the model. Once all 1 second level predictions are obtained from the model, we evaluate the predictions at different time-scales: 1 s, 5 s, 10 s and track-level. We aggregate over time by max-pooling the predictions and annotations for longer time-scale evaluation.

Results

As expected, the CNN and CRNN models outperform the Fully Connected architectures. The CNN or the CRNN perform very similarly and we attribute that to the choice of input time context. For only a 1 second input, there are only a few time-steps for the recurrent network to learn temporal features from, hence the insignificant change in performance over the CNN. An encouraging finding was that the models perform well for rare instruments also.

We also propose a method for visualizing confusions in a multi-label context, shown in the figure above. We visualize the distribution of false negatives for all instruments conditioned on a false positive of a particular instrument. For example, the first row in the matrix represents the distribution of false negatives of all instruments conditioned on the acoustic guitar false positives. We observe several cases of confusions that make sense musically, for example: different guitars, tabla and drums, synth and distorted guitars being confused.

For more details on the various processing steps, detailed results and discussion, please check out the paper here! Additionally, a 3 and a half minute lightning talk given at the ISMIR conference is accessible here.

Assessment of Student Music Performance using Deep Neural Networks

by Ashis Pati

Moving Towards Automatic Music Performance Assessment Systems

Improving one’s proficiency in performing a musical instrument often requires constructive feedback from a trained teacher regarding various aspects of a performance, e.g., its musicality, note accuracy, rhythmic accuracy, which are often hard to define and evaluate. While the positive effects of a good teacher on the learning process is unquestionable, it is not always practical to have a teacher during practice. This begs the questions if we can design an autonomous system which can analyze a music performance and provide the necessary feedback to the student. Such a system will allow students without access to human teachers to learn music, effectively enabling them to get most out of their practice sessions.

What are the limitations of the current systems?

Most of the previous attempts (including our own) at automatic music performance systems have relied on:

  1. Extracting standard audio features (e.g. Spectral Flux, Spectral Centroid, etc.) which may not contain relevant information pertaining to a musical performance
  2. Designing hand-crafted features from music which are based on our (limited?) understanding of music performances and their perception.

Considering these limitations, relying on standard and hand-crafted features for the music performance assessment tasks leads to sub-optimal results. Instead, feature learning techniques which have no “prejudice” and can learn relevant features from the data have shown promise at this task.
Deep Neural Networks (DNNs) form a special class of feature learning tools which are capable of learning complex relationships and functions from data. Over the last decade or so, they have emerged as the architecture-of-choice for a large number of discriminative tasks across multiple domains such as images, speech and music. Thus, in this study, we explore the possibility of using DNNs for assessing student music performances. Specifically, we evaluate their performance with different input representations and network architectures.

Input Representations and Network Architectures

We chose input representations at two different levels of abstraction: a) Pitch Contour which extracts high level melodic information, and b) Mel-Spectrogram which extracts low-level information across several dimensions such as pitch, amplitude and timbre. The flow diagram for the computation of the input representations is shown in the Figure below:

Flow diagram for computation of input representations. F0: Fundamental frequency, MIDI: Musical instrument digital interface

Three different model architectures were used: a) A fully convolutional model with Pitch Contour as input (PC-FCN), b) A convolutional recurrent model with Mel-Spectrogram at input, and (M-CRNN) c) A hybrid model combining information both the input representations (PCM-CRNN). The three model architectures are shown below.

Experiments and Results

For data, we use the student performance recordings obtained from the Florida All-State auditions. Each performance is rated by experts along 4 different criteria: a) Musicality, b) Note Accuracy, c) Rhythmic Accuracy, and d) Tone Quality. Moreover, we consider two categories of students at different proficiency levels: a) Symphonic Band and, b) Middle School and design separate experiments for each category. Three instruments are considered: Alto Saxophone, Bb Clarinet and Flute.
The models are trained to predict the ratings (which are normalized between 0 and 1) given by the experts. As baseline, we use a Support Vector Regression based model (SVR-BD) which relies on standard and hand-crafted features extracted from the audio signal. More details about the baseline model can be found in our previous blog post. The performance of the models at this regression task is summarized as the plot in Figure 6. The coefficient of determination (R2) is used as the evaluation metric (higher is better).

Evaluation results showing R2 metric for all assessment criteria. SVR-BD: Baseline Model, PC-FCN: Fully Convolutional Pitch Contour Model, M-CRNN: Convolutional Recurrent Model with Mel Spectrogram, PCM-CRNN: Hybrid Model Combining Mel-Spectrogram and P. Left: Symphonic Band, Right: Middle School

The results clearly show that the DNN based models outperform the baseline model across all 4 assessment criteria. In fact, the DNN models perform the best for the Musicality criterion which is arguably the most abstract and is hard to define. In the absence of a clear definition, it is indeed difficult to design features to describe musicality. The success of the DNN models at modeling this criterion is, thus, extremely encouraging.

Another interesting observation is that the pitch contour based model (PC-FCN) outperforms every other model for the Symphonic Band students. This could indicate that the high-level melodic information encoded by the pitch contour is important to assess students at a higher proficiency level since one would expect that the differences between individual students would be finer. The same is not true for Middle School students where the best models use the Mel-Spectrogram as the input.

Way Forward

While the success of DNNs at this task is encouraging, it should be noted, however, that the performance of the models is still not robust enough for practical applications. Some of the possible areas for future research include experimenting with other input representations (potentially raw audio), adding musical score information as input to the models and training instrument specific models. It is also important to develop better model analysis techniques which can allow us to understand and interpret the features learned by the model.
For interested readers, the full paper published in the Applied Sciences Journal can be found here.

Guitar Solo Detection

by Ashis Pati

Over the course of the evolution of rock, electric guitar solos have developed into an important feature of any rock song. Their popularity among rock music fans is reflected by lists found online such as here and here. The ability to automatically detect guitar solos could, for example, be used by music browsing and streaming services (like Apple Music and Spotify) to create targeted previews of rock songs. Such an algorithm would also be useful as a pre-processing step for other tasks such as guitar playing style analysis.

What is a Solo?

Even though most listeners can easily identify the location of a guitar solo within a song, it is not a trivial problem for a machine. Looking at it from an audio signal perspective, solos can be very similar to some of the other techniques such as riffs or licks.

Therefore, we define a guitar solo as having the following characteristics:

  • The guitar is in the foreground compared to other instruments
  • The guitar plays improvised melodic phrases which don’t repeat over measures (differentiate from a riff)
  • The section is larger than a few measures (differentiate from a lick)

What about Data?

In the absence of any annotated dataset of guitar solos, we decided to create a pilot dataset containing 60 full-length rock songs and annotated the location of the guitar solos within the song.  Some of the songs contained in the dataset include classics like “Stairway to Heaven,” “Alive,” and “Hotel California.” The sub-genre distribution of the dataset is shown in Fig. 1.

What Descriptors can be used to discriminate solos?

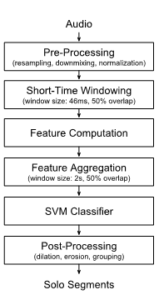
The widespread use of effect pedal boards and amps results in a plethora of different electric guitar “sounds,” possibly almost as large as the number of solos themselves. Hence, finding audio descriptors capable of discriminating a solo from a non-solo part is NOT a trivial task. To gauge how difficult this actually is, we implemented a Support Vector Machine (SVM) based supervised classification system (see the overall block diagram in Fig. 2).

In addition to the more ubiquitous spectral and temporal audio descriptors (such as Spectral Centroid, Spectral Flux, Mel-Frequency Cepstral Coefficients etc.), we examine two specific class of descriptors which intuitively should have better capacity to differentiate solo segments from non-solo segments.

  • Descriptors from Fundamental Pitch estimation:
    A guitar solo is primarily a melodic improvisation and hence, can be expected to have a distinctive fundamental frequency component which would be different from that of another instrument (say a bass guitar). In addition, during a solo the guitar will have a stronger presence in the audio mix which can be measured using the strength of the fundamental frequency component.
  • Descriptors from Structural Segmentation:
    A guitar solo generally doesn’t repeat in a song and hence, would not occur in repeated segments of a song (e.g., chorus, song). This allows to leverage existing structural segmentation algorithms in a novel way. A measure of the number of times a segment has been repeated in a song and the normalized length of the segment can serve as useful inputs to the classifier.

By using these features and post-processing to group the identified solo segments together, we obtain a detection accuracy of nearly 78%.

The main purpose of this study was to provide a framework against which more sophisticated solo detection algorithms can be examined. We use relatively simple features to perform a rather complicated task. The performance of features based on structural segmentation is encouraging and warrants further research into developing better features. For interested readers, the full paper as presented at the 2017 AES Conference on Semantic Audio can be found here.

Automatic drum transcription using the student-teacher learning paradigm with unlabeled music data

by Chih-Wei Wu

Building a computer system that “listens” and “understands” music is the goal of many researchers working in the field of Music Information Retrieval (MIR). To achieve this objective, identifying effective ways of translating human domain knowledge into computer language is the key. Machine learning (ML) promises to provide methods to fulfill this goal. In short, ML algorithms are capable of making decisions (or predictions) in a way that is similar to human experts; this is achievable by browsing and observing patterns within so called “training data.” When large amounts of data are available (e.g., images and text), modern ML systems can perform comparably or even outperform human experts in tasks such as object recognition in images.

Similarly, to train a successful ML model for MIR tasks, (openly available) data also plays an essential role. Useful training data usually includes both the raw data (e.g., audio files, video files) and annotations that describe the answer for a certain task (such as the music genre, the tempo of the music). With a reasonable amount of data and correct ground truth labels, the ML models may build a function that maps the raw data to their corresponding answers.

One of the first questions new researchers ask is: “How much data is needed to build a good model?” The short answer to the first question is the more the better. This answer may be a little unsatisfying, but it is often true for ML algorithms (especially the increasingly popular deep neural networks!). The human annotation of data, however, is labor-intensive and does not scale well. This situation gets worse when the target task requires highly skilled annotators and crowdsourcing is not an option. Automatic Drum Transcription (ADT), a process that extracts the drum events from the audio signals, is a good example of such skill demanding task. To date, most of the existing ADT datasets are either too small or too simple (synthetic).

To find a potential solution for this problem, we try to explore the possibility of having ML systems learn from the data without labels (as shown in Fig. 1).

unlabeled data
The concept of learning from unlabeled data

Unlabeled data has the following advantages: 1) it is easily available compared to labeled data, 2) it is diverse, and 3) it is realistic.

We explore a fascinating way of using unlabeled data referred to as the “student-teacher” learning paradigm. In a way, it uses “machines to teach machines.” As researchers have been working on systems for drum transcription before, these existing systems can be utilized as teachers. Multiple teachers “transfer” their knowledge to the student and the unlabeled data is used as the medium to carry the knowledge of the teachers. The teachers make their predictions on the unlabeled data and the student will try to mimic the teachers’ predictions and become better and better at certain task. Of course, the teachers might be wrong, but the assumption is that multiple teachers and a large amount of data will compensate for this.

System flowchart

Figure 2 shows the presented system consisting of a training phase and a testing phase. During the training phase, all teacher models will be used to generate their predictions on the unlabeled data. These predictions will become “soft targets” or pseudo ground truth. Next, the student model is trained on the same unlabeled data with the soft targets. In the testing phase, the trained student model will be tested against an existing labeled dataset for evaluation.

The exciting (preliminary) result of this research is that the student model is actually able to outperform the teachers!  Through our evaluation, we show that it is possible to get a student model that outperforms the teacher models on certain drum instruments for ADT task. This finding is encouraging and shows  the potential benefits we can get from working with unlabeled data.

For more information, please refer to our full paper. The unlabeled dataset can be found on github.

MDB Drums dataset for automatic drum transcription

by Chih-Wei Wu

Data availability is the key to the success of many machine learning based Music Information Retrieval (MIR) systems. While there are different potential solutions to deal with insufficient data (for instance., semi-supervised learning, data augmentation, unsupervised learning, self-taught learning), the most direct way of tackling this problem is to create more annotated datasets.

Automatic Drum Transcription (ADT) is, similar to most of the MIR tasks, in need of more realistic and diverse datasets. However, the creation process of such datasets is usually difficult for the following reasons: 1) the synchronization between the drum strokes the onset times has to be exact. In previous work, this was done by installing triggers on the drum sets. However, the installation and the recording process also limits the size of the dataset. Another work around solution is to synthesize drum tracks with user defined onset time and drum samples; this will result in drum tracks with perfect ground truth, but the resulting music might be unrealistic and unrepresentative of the real-world music. 2) the variety of the drum sounds has to be high enough to cover a wide range from electronic to acoustic drum sounds. Most of the previous work only uses a small subset of drum sounds (e.g., certain drum machines or a few drum kits), which is not ideal in this regard. 3) the playing techniques can be hard to differentiate, especially on instruments such as snare drum. A majority of existing datasets only contain the annotations of the basic strikes for simplicity.

We try to address the above mentioned difficulties by introducing a new ADT dataset with a semi-automatic creation process.

Why MDB?

The goal of this project is to create a new dataset with minimum effort from the human annotators. In order to achieve this goal, a robust onset detection algorithm to locate the drum events is important. To ensure the robustness of the onset detector, we want the input signal to be as clean as possible. However, we also want to have a signal to be as realistic as possible (i.e., polyphonic mixtures of both melodic and percussive instruments). With these considerations in mind, we decided to avoid collecting a new dataset from scratch but rather work on the existing dataset with desirable properties.

As a result, the MusicDelta subset in the MedleyDB dataset is chosen for its:

  1. Multitrack format. This can potentially increase the robustness of onset detector and facilitate the semi-automatic annotation process. In addition, the multitrack files can be mixed in any arbitrary combination, providing more possibilities for experimentation.
  2. Real-world recordings. This means the recordings are more realistic and closer to the real use cases. Also, the diversity in terms of music genres offers a more representative sample pool.

Dataset creation

The processing flow of the creation of MDB Drum is shown in Fig. 1. First, the songs in the selected dataset are processed with an onset detector. This provides a consistent estimation of the onset locations. Next, the onsets are labeled with their corresponding instrument names (i.e., Hi-hat, Snare Drum, Kick Drum). This step inevitably requires manual annotation from the human experts. Following the manual annotation, a set of automatic checks were implemented to examine the annotations for common errors (e.g., typos, duplicates). Finally, the human experts went through an iterative process  of cross-checking their annotations prior to the release of the dataset.

Flowchart of the dataset creation process

An dataset example is shown in Fig. 2. The original polyphonic mixture (top) appears noisy, and it is difficult to locate the drum events through both listening and visual inspection. The drum-only recording (middle), however, has sharp attacks and short decays in the waveform, providing a cleaner representation for the onset detector. Finally, the detected onsets (bottom), as marked in red, are relatively accurate, which greatly simplifies the process of manual annotation.

One example of the semi-automatic annotation process

Dataset

The resulting dataset contains 23 tracks of real-world music with a diverse distribution of music genres (e.g., rock, disco, grunge, punk, reggae, jazz, funk, latin, country, britpop, to name just a few). The average duration of the tracks is around 54s, and the number of annotated instrument classes is 6 (only major classes) or 21 (with playing techniques). The users may choose to mix the multitracks in any combination (e.g., guitar + drum, bass + drum) due to the multitrack format of the original MedleyDB dataset.

All details can be found in our short paper here.


Objective descriptors for the assessment of student music performances

by Amruta Vidwans

Learning a musical instrument is difficult. It needs regular practice, expert advice, and supervision. Even today, musical training is largely driven by interaction between student and a human teacher plus individual practice session at home.

Can technology improve this process and the learning experience? Can an algorithm perform an assessment of a student music performance? If yes, we are one step closer to a truly musically intelligent music tutoring system  that will support students learn their instrument of choice by providing feedback on aspects like rhythmic correctness, note accuracy, etc. An automatic assessment is not only useful to students for their practice sessions but could also help band directors in the auditioning and (pre-)selection process. While there are a few commercial products for practicing instruments, the assessment in these products is usually either trivial or opaque to the user.

The realization of a musically intelligent system for music performance assessment requires knowledge from multiple disciplines such as digital signal processing, machine learning, audio content analysis, musicology, and music psychology. With recent advances in Music Information Retrieval (MIR), noticeable progress has been made in related research topics.

Despite these efforts, identifying a reliable and effective method for assessing music performances remains an unsolved problem. In our study, we explore the effectiveness of various objective descriptors by comparing three sets of features extracted from the audio recording of a music performance, (i) a baseline set with common low-level features (often used but hardly meaningful for this task), (ii) a score-independent set with designed performance features (custom-designed descriptors such as pitch deviation etc., but without knowledge of the musical score), and (iii) a score-based set with designed performance features (taking advantage of the known musical score). The goal is to identify a set of meaningful objective descriptors for the general assessment of student music performances. The data we used covers Alto Saxophone recordings of three years of student auditions (Florida state auditions) rated by experts in the assessment categories of musicality, note accuracy, rhythmic accuracy, and tone quality.

Label: Musicality E1 E2 E3 E4
Correlation (r) 0.19 0.49 0.56 0.58

Our observations (as seen in Table 1) are that, as expected, the baseline features (E1) are not able to capture any qualitative aspects of the music performance so that the regression model mostly fails to predict the expert assessments . Another expected result is that score-based features (E3) are able represent the data generally better than score-independent features (E2) in all categories. The combination of score-independent and score-based features (E4) show some trend to improve results, but the gain remains small, hinting at redundancies between the feature sets. With values between 0.5 and 0.65 for the correlation between the prediction and the human assessments, there is still a long way to go before computers will be able to reliably assess student music performance, but the results show that an automatic assessment is possible to a certain degree.

To learn more, please see the published paper for details.

Header image used with kind permission of Rachel Maness from http://wrongguytoask.blogspot.com/2012/08/woodwinds.html